

1. Setup
Goals
Something that it's quite a straight forward
process, it's actually neglected by the majority of people and this is the fact
that after you install the tracking code on your website you need to setup goals.
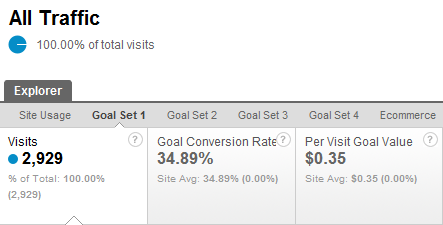
Google
Analytics Goals
The goals you setup for your website are the
foundation of your website analysis because everything gravitates around your
goals and conversion rates, the goals that are ultimately your business goals.
If you are wondering what goals you need to
setup, start by asking yourself what is the purpose of your website. Is it an
eCommerce site and you want to sells tangible goods, is it a blog where you
want to make revenue from ads, do you sell eBooks or services? What is the main
purpose of your site?
Then, once you figure this out you can go and
start setting up goals base on your business objectives.
If this is still unclear for you, here are
some examples that will give you traction:
Ø
conversion rates for your products
Ø
Engaged Visitors - people who spend more than one minute on your
site
Ø
Readers - people who visit at least two pages on your site
Ø
Calls to action - use event tracking (see below in the article) to
measure calls to action
Ø
Best performing ads - again, use event tracking to measure your
best performing ads
Ø
Subscriptions - check how the visitors who subscribe to your list
behave
Ø
Purchases - if you sell eBooks or courses you can get insights
about your buyers
Later, these goals will help you track
conversion rates and get insights about what are the main traffic sources that
send you visitors which convert, what are the keywords who send you customers,
which page your visitor use most to sign up for your newsletter, where are your
customers from and examples can continue.
Use these examples to get started, but please
note that every website is unique and it will have unique goals.
2. Connect
your Google Webmaster Tools account
Google Webmaster Tools is another free
product from Google which helps you see data about your website such as the
number of impressions for your search queries and their position in Google, the
number of links to your site or diagnosis information reported by Google aftercrawling your website.

Google
Analytics and Google Webmaster Tools
Additionally, you can check +1 metrics, your
site performance or submit a sitemap for Google to index.
But what the really interesting thing is the
fact that you can connect your Google Webmaster Tools account with your Google
Analytics account and get access to the new Search Engine Optimization reports.
Once you do that, you will be able to see
three new reports in your Google Analytics account: Queries, Landing Pages and
Geographical Summary. They will help you learn more about your top performing
search queries (keywords) and landing pages.
Then, you
can use that data to identify:
Ø
Keywords with a low click through rate, but a good average
position. Once you know them, you can change the meta title and description of
your page to improve their click through rate.
Ø
Landing pages with a good click through rate, but a low average
position. These pages can be easily run through an on-page optimization process
that will improve their rankings.
Ø
What are the countries of your organic visitors and who your
target market is.
Ø
To connect your site from Google Webmaster Tools in Google
Analytics, go to the [Traffic Sources] section, select [Search Engine
Optimization] and then one of the three reports.
At this stage you will see a page with the
benefits of linking your accounts and a button where it says [Set up Webmaster
Tools data sharing]. Click that button and then click [Edit] from the
[Webmaster Tools Settings].
Then, you will be redirected to your Google
Webmaster Tools where you can connect it with Google Analytics.
3. Enable
Site Speed
Site speed is also a neat feature of Google
Analytics that lets you see the load time of your pages. This will help you
check what pages need your attention and determine you to look for ways of
speeding up the load time of your pages.
If you wonder why this is important, I can
tell you that the load speed of your pages can significantly improve your
visitors experience on your site and it's also a ranking factor in Google.
So a good load speed can make your visitors
happy and can also increase your rankings.

Google
Analytics Site Speed
Along with the number of Page Views and
Bounce Rate, you can see the Average Page Load Time (in seconds) and the number
of visits that have been used as a sample for every page on your website.
Additionally, if you click on the
[Performance] tab, you can check different buckets of your page load time and
see what is the average load speed of your pages.

Page Load
Time Buckets
The [Map Overlay] will show you what the load
speed for different countries or territories is.
If before you needed to add an additional
code to your Google Analytics tracking, now that is no longer required and
Google Analytics will automatically add data to your reports.
4. Enable
Site Search
It's a fact that visitors who use the search
box on your site are more likely to convert than the ones who don't. The reason
why this happens is because they are more engaged with your website, with your
content or your products and services.

Google
Analytics Site Search
The beautiful thing about site search is that
it lets you discover the exact keywords that people use to search for your
products, so you can take this a step further and use them in your search
engine optimization campaigns.
You can actually use the most important
keywords that people use to search on your site to optimize your pages and
drive more targeted traffic to your website.
Additionally, they might look for products or
services that you do not have on your offer, but you can add them with little effort
and increase your sales.
Or if you have a blog, site search is a great
way to see what your readers are looking for and get a ton of article ideas out
of them.
If you would like to enable site search on
your website, first make sure that you have a search form on your site and then
enable Site Search in Google Analytics.
5. Track
Events
Event tracking is a powerful feature in
Google Analytics that can help you track among others:
Ø How many
people download your eBook
Ø What ads are
performing better and who clicks on your ads
Ø Which signup
form converts better (sidebar, below the post, about page)
Ø Who pauses,
fast forward or stops a video
Ø What errors
a visitor encounters during the checkout
Ø Google
Analytics Site Search
But that is not all. Using the latest version
of Google Analytics, you are also able to set these events as goals which can
help you see the performance of your events based on different metrics.
Enabling event tracking it's not a hard
process. All you have to do is just add the code below next to your URL, before
you replace the default values.
onclick="_gaq.push(['_trackEvent',
'category', 'action', 'opt_label', 'opt_value']);"
These default values will help you identify
your events and here's what they represent:
Ø Category –
You can use this element to identify what you want to track: eBook, video,
signup form, ads.
Ø Action –
This element can be used to define the interaction of your visitor and can be:
click, button, play, and stop. Personally, I use it to specify the place of my
button/signup form/ad.
Ø Label – Use
this to identify the type of event that is tracked.
Ø Value – This
element helps you specify a value for you event that can be used when you setup
a goal for your event.
If you would like to see a working example,
here's what I used to track a link to my new product, where "Ads" is
the category of my link, "Sidebar" the place where I added the link
and "WAB" the label.
<ahref="http://www.webanalyticsblueprint.com/"
onclick="_gaq.push(['_trackEvent', 'Ads', 'Sidebar', 'WAB']);">
Then once you setup your links, all you have
to do is just setup that event as a goal, using the Category, Action, Label,
and Value conditions you have setup for your event.
6. Real-Time
Reporting
Google has taken analytics one step further
recently and introduced Real-Time Reporting, which displays information about
visitors that are on your website in a specific moment.

Real Time
Reporting
You are able to see how many visitors are on
your website in that moment, where they are on your website, from where they
come (keywords and referrals) and where they live.
Additionally, you have access to another 3
reports with more insights about their location, how they arrived on your
website and what pages they visit.
To access the real-time reports you need to
go to the [Home] menu > [REAL-TIME (BETA)].
The [Locations] report will provide you
information about the number of your visitors and the countries where they are
located. You can also check their location on a map.
[Traffic Sources] will display information
about where they come from. You will see the medium and source along with the
total number of your visitors.
The [Content] report will show you what are
the active pages that your visitors read and how many active visitors are on
each of the pages displayed on your report.
7.
Multi-Channel Funnels
With Multi-Channel Funnels Google Analytics
provides even more value for users who are passionate about conversion rates.
If before you were able to track the last
source that the visitor used to convert, with Multi-Channel Funnels you are
able to also track other sources (ads, referrals, social media, organic) that
the visitor used to reach your website from.
Let's say for example that your visitor
(Cindy) landed for the first time on your website from Twitter and subscribed
to your RSS feed.
Next time, Cindy used the feed reader to come
and read your new articles. Ultimately she was looking for advice on blogging
and found your eBook using a search engine.
Now, because she knows your site already, she
will buy it and become a customer.
Using this example, in the old version of
Google Analytics the search engine was used to be credited for the conversion,
but now, with Multi-Channel Funnels you can see the whole path that Cindy took
to convert: Social Network > Referral > Search engine.
To check the Multi-Channel Funnels reports,
go to the [Conversions] section.
Watch this video to learn more about
Multi-Channel Funnels:
8. Use
Campaign Tracking
Tracking online marketing campaigns will help
you get past that large number of direct visits that come from URL softeners
like bit.ly or clients like tweet deck.
Additionally, it will help you track more
accurately links from other websites and links that you use to promote your
content or campaigns.
In order to use Campaign tracking in Google
Analytics, you need to tag your URLs with special parameters. Those parameters
can be added to your links using the URL Builder tool from Google.
Once you tag your URLs with the mandatory
parameters, use them as they are or use an URL shortened when sharing them.
Then, check the [Campaigns] report, under
[Traffic Sources] > [Sources] to get insights about your online marketing
campaigns.

To see step by step instructions and how to
check Google Analytics Campaign Tracking reports, read more in this article.
9. Plot Rows
Plot Rows allows you to create instant
segments of your data in tabular reports. If you usually look at standard
reports, you can use Plot Rows to get more insights from your metrics.

Google
Analytics Plot Rows
To use this feature, you need to select two
rows from any tabular report and then click the [Plot Rows] button from the
bottom of the table.
Once you do that, you will see that the chart
has changed and you are able to see additional information there about the items
that you have selected.
In other words it instantly creates a segment
with two of your items compared with the total metrics.
Use this feature to check how your main
keywords, referrals or pages compare with each other and with the overall
metrics of the site.
But make sure that you select items that do
not have a big difference between their metrics (i.e. compare a keyword with
2340 visits with one that has 154).
10. Custom
Dashboards
In the old version of Google Analytics you
used to have available only one dashboard. However, right now you can create up
to 20 dashboards customized to your needs.

Custom
Dashboards
To create a custom dashboard, go to the
[Home] menu > [Dashboards] and select [+New Dashboard].
Once you do that, you will need to choose
whether you will want to start from scratch with a blank canvas or get some
pointers with the [Starter Dashboard].
Then you can use slick widgets to create
custom metrics, pie charts, timelines or tables.
To get started with custom dashboards, have a
look at my screenshot above and try to duplicate it or check out 5 Insightful
Google Analytics Dashboards.
Then, you will be able to customize it and
add the metrics that are relevant to your business.
11. Flow
Visualization
Flow Visualization definitely deserves a
separate article to present it, but in the meantime I will outline it's
benefits.

Flow
Visualization
Google Analytics rolled out two reports,
[Visitors Flow], under the Audience section and [Goal Flow], under the
Conversion section.
Visitors
Flow
The Visitors Flow will display the path that
your visitors have taken to navigate through your website.
You will be able to see, based on a selected
dimension, such as country source or keyword, the exact path of your visitors
and where they stopped to read your content.
On hover, the report displays for each page
additional details, like the total number of visits, how many visitors moved to
a different page and how many of them dropped the funnel and left.
If you click on a page, you will be able to
highlight the traffic that went through that page, explore traffic through that
page or display in a popup even more details.
Goal Flow
The Goal Flow report is essentially a better
representation of the Funnel Visualization report and contains the same
dimensions as the Visitors Flow report.
But the main difference between this and the
Visitors Flow is the fact that the Goal Flow report doesn't uses all pages, but
the steps you configured in the conversion funnel.
Additionally, you can also use advanced
segments to filter your data and get additional insights from the Visitors Flow
and Goal Flow reports.


I like your post thanks for sharing Its informative to me I learn many more things about this blog.
ReplyDeleteIts mindblowing Blog. I will wait for next blog.
SEO Company In Mumbai
SEO Serives In Mumbai